Fusion Markets

Welcome to our Blog

Every so often, we post articles we think you might find useful and will help you grow as a trader.

Loading...
No results
Trading and Brokerage
post image main
Index CFD Dividends | Week 29/4/2024
Fusion Markets


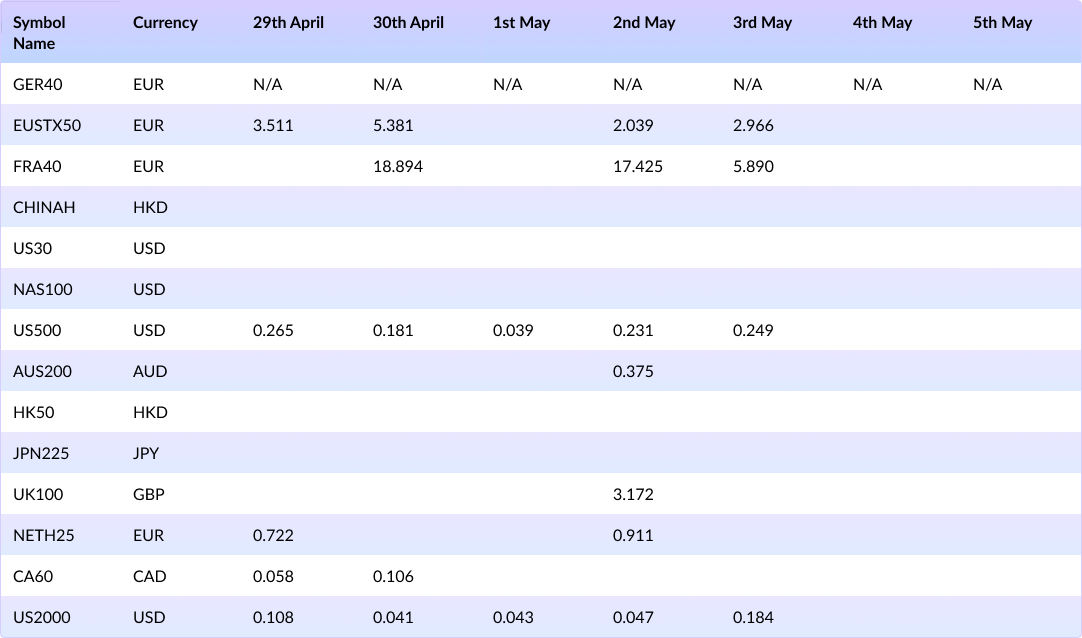
Please see the table below for any upcoming dividend adjustments on indices for the week starting April 29th.


Index CFD Dividends | Week 29/4/2024

* Please note these figures are quoted in the index point amount


What is a dividend?


Dividends are a portion of company earnings given to shareholders. As indices are often composed of individual shares, an index dividend pays out based on individual shares proportional to the index’s weighting.


Trading on a CFD Index does not create any ownership of the underlying stocks, or an entitlement to receive the actual dividends from these companies.


What is an ex-dividend date?


An ex-dividend date is the cut-off date a share must be owned in order to receive a dividend. If an investor buys a share after the ex-dividend date, then they will not be entitled to earn or pay the next round of dividends. This is usually one business day before the dividend.


Do dividends affect my position?


Share prices should theoretically fall by the amount of the dividend. If the company has paid the dividend with cash, then there is less cash on the balance sheet, so in theory, the company should be valued lower (by the amount of the dividend).


Due to the corresponding price movement of the stock index when the ex-dividend date is reached, Fusion must provide a 'dividend' adjustment to ensure that no trader is positively or negatively impacted by the ex-dividend event.


How will the dividend appear on my account?


The dividend will appear as a cash adjustment on your account. If your base currency is different from the currency the dividend is paid out in, then it will be converted at the live FX rate to your base currency.


Why was I charged a dividend?


Depending on your position, given you are holding your position before the ex-dividend date, you will either be paid or charged the amount based on the dividend. Traders shorting an index will pay the dividend, whereas traders who are long the index will be paid the dividend.


Why didn’t I receive my dividend?


You may not have received a dividend for a number of reasons:


- You entered your position after the ex-dividend date

- You are trading an index without dividend payments

- You are short an index


If you believe the reasons above do not apply to your position, please reach out to our support team at [email protected] and we’ll investigate further for you.


Forex Trading
CFD Trading
Dividends
22.04.2024
Pine Script
post image main
How to Use Pine Script for Trading on TradingView
Fusion Markets


There are a number of ways to automate your trading with the programming language you use depending on the platform you trade on. For example, MetaTrader 4/5 traders use EAs coded in mql4/5, cTrader uses cbots coded in c#, and TradingView traders use Pinescript.  


Pine Script is a domain-specific language developed by TradingView that allows traders to create custom technical indicators and strategies, turning the platform into a powerhouse for market analysis.  


In this blog post, we will walk you through everything you need to know about using PineScript for Forex trading. 


Contents


What_Is_PineScript

Getting Started

PineScript Syntax

Conditional Statements and Loops

Developing Strategies

Backtesting Your Strategy

Common Pitfalls to Avoid

Conclusion


What Is PineScript


PineScript is a coding language developed by TradingView specifically for creating indicators and strategies on their platform. It is similar to other programming languages, but with its own unique syntax and functions tailored for trading analysis.  


Don't let the idea of coding scare you – the syntax is similar to other popular languages like JavaScript and C++, making it easy for traders with coding experience to pick up. Plus, with the large online community and resources available, you can easily learn and use Pinescript in a matter of days. 


Getting Started


To start using PineScript on TradingView, you will need a TradingView account. If you don't have one yet, go ahead and sign up – it's free! Make sure to connect it to your Fusion Markets account. Once you have an account, navigate to the "Pine Editor" tab on the top menu bar. 


Next, open the PineScript editor on TradingView and choose from a variety of templates or start from scratch. The editor also includes a preview function that allows you to see how your code will look on a chart in real-time. 


You will also need to have a basic understanding of coding concepts such as variables, functions, and conditional statements. If these terms sound foreign to you, don't worry we’ve got you covered!  


PineScript Syntax


At the core of Pine Script's functionality is its syntax, which forms the building blocks of any script. Its power lies in its simplicity and flexibility, enabling users to craft a wide array of technical analysis tools.  


Here are a few main things that you should know: 


Variables and Data Types 


Variables in Pine Script play a crucial role in storing and manipulating data. They come in different types such as integers, floats, bools, strings, and series. Variables in PineScript are declared using the "var" keyword, followed by the variable name and an equal sign (=) before the value assigned to it. For example: `var myVariable = 10;`.   


Understanding these data types is fundamental. For instance, a series type is used for time series data, enabling the creation of moving averages, oscillators, and more. 


undefined


In this example, ` length` is an integer variable that stores the input value for the length of the moving average, and ma is a series variable that stores the moving average data. 


Functions and Operators 


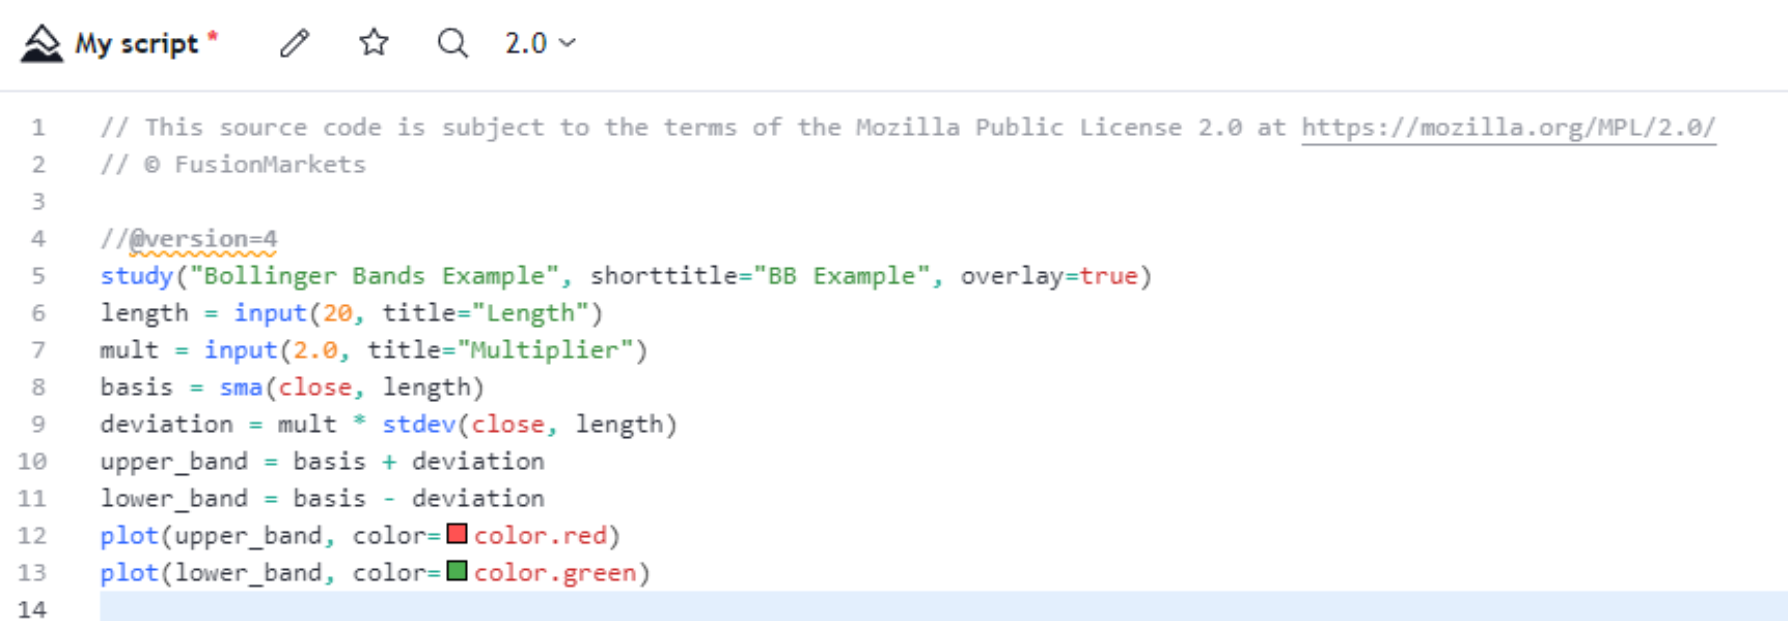
Pine Script offers an extensive range of built-in functions and operators for performing calculations and executing specific actions. Functions in PineScript start with the "study" keyword, followed by the name of the function and parentheses. For example: `study("My Custom Indicator")`   


Functions like ` sma() ` (simple moving average) and ` plot() ` aid in technical analysis by computing indicators and displaying plotted lines on the chart.  


undefined


Here, ` sma() `, ` stdev() `, and arithmetic operators (` + `, ` ` -) are used to compute Bollinger Bands by calculating the moving average, standard deviation, and upper and lower bands. 


Conditional Statements and Loops 


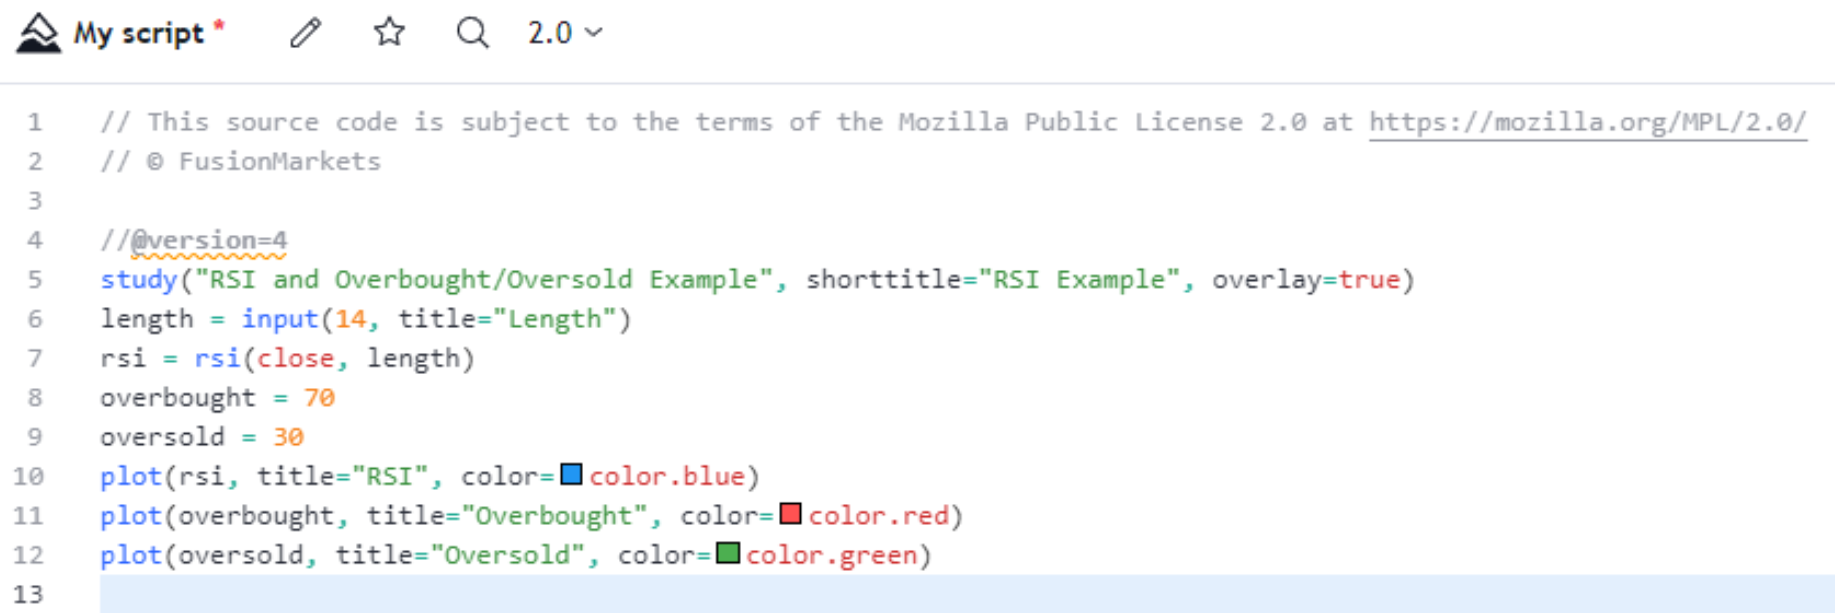
Conditional statements and loops are essential for decision-making and iterative processes. Using ` if-else` statements and ` for ` loops, traders can create dynamic conditions and repetitive actions within their scripts. 


undefined


In this snippet, an RSI (Relative Strength Index) script displays the RSI values along with overbought and oversold levels. Conditional statements can be applied to trigger alerts or make trading decisions based on RSI levels crossing certain thresholds. 


Understanding variables, functions, conditional statements, and loops is pivotal for crafting effective indicators and strategies. With a solid grasp of PineScript syntax, traders can develop personalised trading tools, enhancing their analysis and decision-making in the financial markets. To learn more about the syntax, please refer to the PineScript language manual. 


Creating Custom Indicators 


One of the most popular uses for PineScript is creating custom indicators. This can range from simple moving averages to complex algorithms that incorporate various technical analysis tools. The possibilities are endless, and with some creativity and testing, you can come up with unique and effective indicators for your trading strategy. 


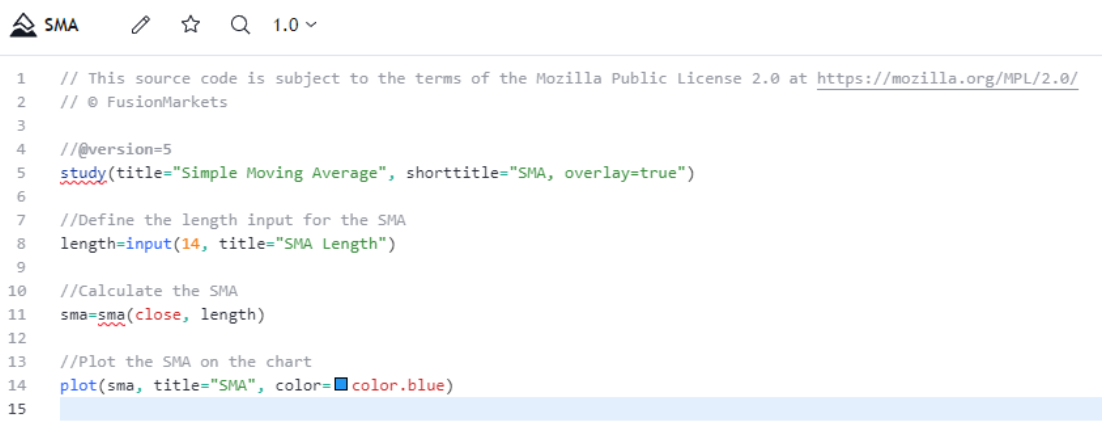
Now, let's walk through the process of creating a simple moving average (SMA) indicator using Pine Script. An SMA is a popular trend-following indicator that smoothens price data to identify the underlying trend. 


undefined


In this script: 


  • We specify the title, short title, and overlay properties for the indicator. 

  • We create an input variable, length, that allows the user to customise the length of the SMA. 

  • We calculate the SMA using the sma() function. 

  • We use the plot() function to display the SMA on the chart. 


This is just a basic example to get you started. Why don’t we take it up a notch? 


Let’s create a strategy that uses the 200 Exponential Moving Average (EMA) as a basis for making buy (long) signals when the price crosses above this moving average. 


undefined


Let's break down the code: 


  • Setting up Strategy Parameters: The script sets the strategy's title, short title, and indicates that it's an overlay on the price chart using strategy(). 

  • Calculating the 200 EMA: It defines a 200-period EMA (ema200) based on the closing prices. 

  • Plotting the 200 EMA: The script plots the 200 EMA on the chart in blue. 

  • Identifying EMA Crossover: It calculates the points where the closing price crosses above the 200 EMA using ta.crossover() and assigns these points to the variable emaCrossover. 

  • Strategy Entry Conditions: When the crossover happens (i.e., when the closing price crosses above the 200 EMA), the strategy generates a "Buy" entry signal using strategy.entry() with the condition when=emaCrossover. 

  • Plotting Buy Signals: The script uses plotshape() to plot small green triangles below the price bars where the crossover condition is met. 


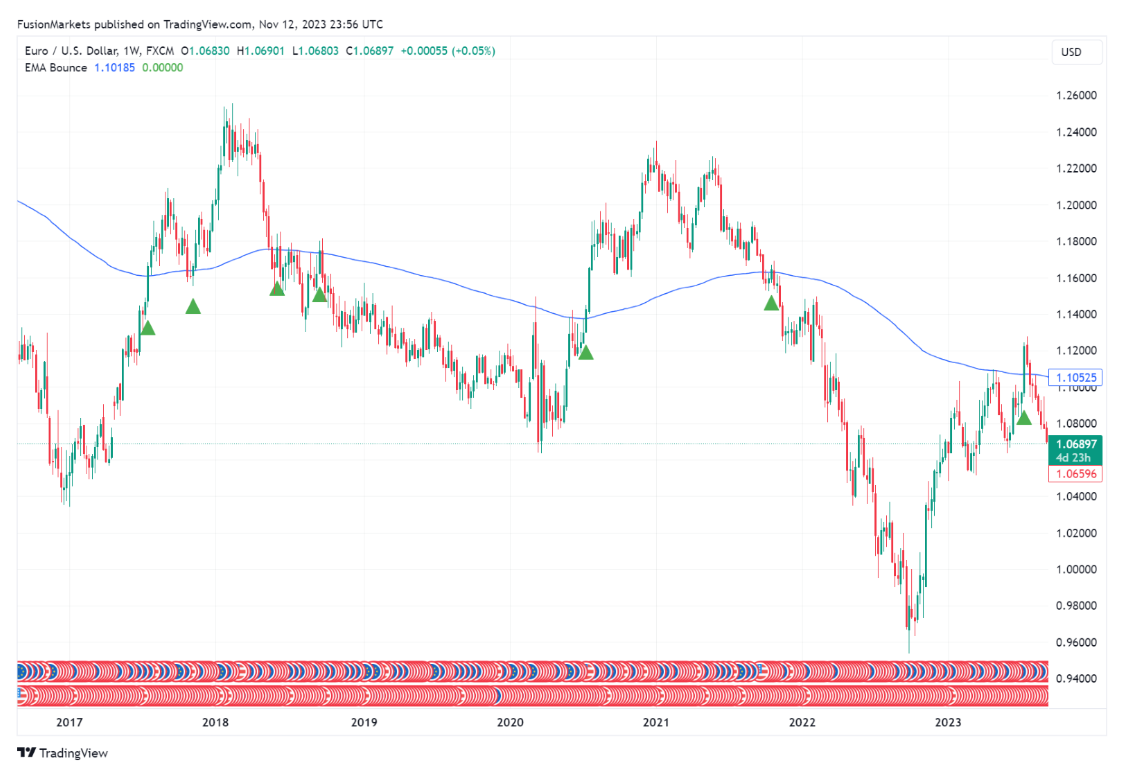
Here’s how it looks on a chart: 


undefined


EURUSD Weekly Chart 


Kindly be aware that the script provided above serves as an example, and it will require adjustments to align with your particular objectives. 


In summary, this script creates buy signals (represented by green triangles below the price bars) whenever the closing price crosses above the 200-period Exponential Moving Average. This strategy assumes that such crossovers might indicate a potential upward trend and trigger a buy action. 


As you can see, Pine Script is incredibly versatile, and you can create highly sophisticated indicators with complex logic to match your trading strategy.


Developing Strategies

Aside from creating indicators, PineScript also allows you to develop fully automated trading strategies. By combining different technical indicators and conditions, you can create a set of rules for buying and selling that can be backtested and optimised for maximum profitability. This feature is especially beneficial for traders who prefer a systematic approach to trading. 


Tips and Tricks 


  • Start with a clear and well-defined trading strategy: Before jumping into coding, it's essential to have a solid understanding of your trading approach and goals. A clear strategy will make it easier to translate it into code and avoid any confusion during development.  

  • Use proper risk management techniques: No matter how well-crafted a strategy is, managing risk is crucial in trading. PineScript offers functions for setting stop-loss and take-profit levels, as well as position sizing based on risk percentage. Utilising these functions can help minimise losses and maximize gains.  

  • Test and refine: Developing a successful trading strategy takes time, patience, and continuous testing. Backtesting with PineScript allows for this refinement process, where traders can analyse the results of their strategies and make necessary adjustments until it meets their expectations.  


Backtesting Your Strategy


Once you've written your Pine Script, it's time to test its performance in various market conditions. TradingView makes this process seamless. You can choose the time frame and historical data you want to test your strategy against. The platform will then run your script against that data, showing you how your strategy would have performed. It helps identify any flaws or weaknesses in the strategy and allows for adjustments before risking real capital. This can significantly increase the chances of success in live trading. 


Common Pitfalls to Avoid


While Pine Script provides endless possibilities for developing your strategies, there are common pitfalls to avoid: 


  • Over-Optimisation: Tweaking your strategy too much based on past data can lead to over-optimisation. Your strategy may perform well historically but fail in real-time trading. 

  • Neglecting Risk Management: Not paying enough attention to risk management can lead to significant losses. It's crucial to protect your capital at all costs. 

  • Lack of Patience: Don't rush into live trading. The more time you spend testing and refining your strategy, the better it will perform in the long run. 

  • Ignoring Market Conditions: Markets are not static, and what works in one type of market might not work in another. Keep an eye on market conditions and be ready to adapt. 


Conclusion


There's a saying in the world of forex trading - "The trend is your friend". And with PineScript, you can easily identify and follow market trends with custom indicators that suit your trading style. From simple moving averages to complex multi-indicator strategies, PineScript allows you to create and test different approaches until you find the one that works best for you. 


But PineScript is not just limited to forex trading. It can also be used in other markets such as stocks and cryptocurrencies. So, if you're a multi-asset trader, learning how to use PineScript can greatly benefit your overall trading strategy and performance. 


Furthermore, PineScript is constantly evolving and being updated with new features. This means that there's always something new to learn and experiment with, keeping your trading skills fresh and adaptable. 


And don't be intimidated by coding - embrace it with PineScript and see how it can enhance your trading. Who knows, you may even discover a hidden passion for programming along the way! 


Forex Trading
TradingView
Beginners
Trading Tips
10.04.2024
General
post image main
Currency Pair Correlations: Enhancing Forex Trading Strategies
Fusion Markets


In the dynamic world of forex trading, understanding and effectively utilising currency pair correlations can significantly enhance trading strategies. For intermediate to advanced traders seeking to deepen their understanding and optimise their approach, delving into the nuances of currency pair correlations is essential. This comprehensive guide will explore the intricacies of currency pair correlations, their relevance in forex trading, and advanced techniques for leveraging correlations to enhance trading strategies.


Contents


Introduction to Currency Pair Correlations

Types of Correlations

Factors Influencing Correlations

Understanding Correlation Coefficients 

Utilising Correlations in Trading Strategies

Identifying Trading Opportunities

Monitoring Correlation Changes

Practical Examples and Case Studies

Conclusion


Introduction to Currency Pair Correlations


Currency pair correlations are a fundamental aspect of forex trading, providing valuable insights into the relationships between different currency pairs. By analysing these correlations, traders can diversify their portfolios, manage risk more effectively, and identify potential trading opportunities.


Currency pair correlations measure the statistical relationship between two currency pairs, indicating how closely their price movements are associated. These correlations can be positive, negative, or neutral, providing valuable information about the interplay between different currencies in the forex market.


Each currency is driven by its own fundamental factors. For example, both New Zealand and Canada are commodity-driven currencies. New Zealand is driven by a strong export of agricultural and dairy product exports, and Canada is heavily involved in oil production and exports and thus is often positively correlated with the price of crude oil. A trader looking for correlations would be smart to analyse the data and price movements of both types of commodities in order to determine if there will be a correlation between the two currencies.


Understanding currency pair correlations is crucial for forex traders seeking to optimize their trading strategies and maximise profitability. By incorporating correlations into their analysis, traders can gain a deeper understanding of market dynamics and make more informed trading decisions.


Types of Correlations


Positive Correlations


Positive correlations occur when the price movements of two currency pairs are positively related, meaning they tend to move in the same direction. For example, the EUR/USD and GBP/USD pairs often exhibit positive correlations, as both currencies are positively correlated with the US dollar. Similarly, AUD/USD and NZD/USD are also closely correlated give that both their currency values are directly impacted by the US Dollar and China trade.


Positive correlations can be leveraged by traders to identify trends and capitalise on momentum in the market. By trading currency pairs with positive correlations, traders can amplify their returns and exploit opportunities for profit.


Negative Correlations


Negative correlations occur when the price movements of two currency pairs are inversely related, meaning they tend to move in opposite directions. For instance, the USD/JPY and EUR/USD pairs may display negative correlations, as the US dollar and Japanese yen often move in opposite directions. Another example of a negatively correlated pair is USD/CNY (US Dollar / Chinese Yuan) .


Negative correlations can be utilised by traders for hedging purposes and risk management. By trading currency pairs with negative correlations, traders can offset potential losses and diversify their portfolios to mitigate risk.


Neutral Correlations


Neutral correlations occur when there is no significant relationship between the price movements of two currency pairs. In this case, the correlation coefficient is close to zero, indicating that the price movements of the two currency pairs are independent of each other.


While neutral correlations may not provide immediate trading opportunities, they are still valuable for advanced traders seeking to analyse market trends and anticipate potential shifts in market sentiment.


Factors Influencing Correlations


Numerous factors can influence currency pair correlations, ranging from economic indicators to geopolitical events. Understanding these factors is essential for traders seeking to anticipate market movements and adapt their strategies accordingly.


Economic Indicators


Economic indicators, such as GDP growth, inflation rates, and interest rate decisions, can have a significant impact on currency pair correlations. For example, positive economic data from the US may strengthen the US dollar and lead to positive correlations between USD pairs.


Advanced traders should closely monitor key economic indicators and assess their potential impact on currency pair correlations. By staying informed about economic developments, traders can anticipate market trends and position themselves accordingly.


Geopolitical Events


Geopolitical events, such as elections, geopolitical tensions, and trade disputes, can also influence currency pair correlations. For instance, uncertainty surrounding Brexit negotiations may lead to increased volatility and negative correlations between GBP pairs.


Advanced traders should be vigilant about geopolitical developments and their potential impact on currency pair correlations. By analysing geopolitical risks and their implications for the forex market, traders can make more informed trading decisions and mitigate potential risks.


Market Sentiment


Market sentiment, including investor risk appetite and market volatility, can affect currency pair correlations. During periods of heightened risk aversion, safe-haven currencies like the US dollar and Japanese yen may strengthen, leading to negative correlations with riskier currencies such as the Australian dollar and New Zealand dollar.


Traders should monitor market sentiment indicators and assess their impact on currency pair correlations. By gauging investor sentiment and market dynamics, traders can identify trading opportunities and adjust their strategies accordingly.


Understanding Correlation Coefficients


Correlation coefficients provide a quantitative measure of the strength and direction of the relationship between two currency pairs. Advanced traders should understand how to interpret correlation coefficients and leverage this information to optimise their trading strategies.


Calculation and Interpretation


Correlation coefficients are calculated using historical price data for the currency pairs under consideration. A correlation coefficient close to +1 or -1 indicates a strong correlation, while a coefficient close to 0 suggests no significant relationship.


Traders should interpret correlation coefficients in the context of their trading strategies and market analysis. By analysing correlation coefficients, traders can identify pairs with strong correlations and capitalise on trading opportunities.


Visualisation with Correlation Matrices


Correlation matrices or charts provide visual representations of correlations between multiple currency pairs. These matrices allow advanced traders to quickly identify correlated and uncorrelated pairs and assess the diversification potential of their portfolios.


Advanced traders should utilise correlation matrices to visualise relationships between currency pairs and identify patterns or trends. By analysing correlation matrices, traders can make more informed decisions about portfolio diversification and risk management.


Utilising Correlations in Trading Strategies


Traders can incorporate currency pair correlations into their trading strategies to optimise performance and maximise profitability. By leveraging correlations effectively, traders can identify trading opportunities and mitigate potential risks.


Diversification and Hedging


Positive correlations between currency pairs can be utilised for diversification purposes, allowing traders to spread risk across correlated assets. Additionally, negative correlations can be used for hedging purposes, where positions in one currency pair are offset by positions in a negatively correlated pair to mitigate risk.


Advanced traders should assess the correlations between currency pairs and adjust their portfolios accordingly. By diversifying their holdings and hedging against adverse movements, traders can protect their capital and optimise their risk-return profile.


Correlation-Based Trading Strategies


Correlation-based trading strategies involve identifying and trading currency pairs with strong correlations. Pair trading strategies involve simultaneously buying one currency pair while selling another negatively correlated pair. Portfolio optimisation strategies aim to create diversified portfolios with uncorrelated assets to minimise risk and maximise returns.


Traders should develop robust trading strategies based on their analysis of currency pair correlations. By incorporating correlation-based strategies into their trading plans, traders can enhance their performance and achieve their financial goals.


Identifying Trading Opportunities


Traders can use correlations to identify trading opportunities based on the strength and direction of correlations between currency pairs. For example, if two positively correlated pairs temporarily diverge in price, traders may consider trading the pair that lags behind in anticipation of convergence.


Advanced traders should conduct thorough analysis of currency pair correlations and market trends to identify trading opportunities. By staying informed about market developments and leveraging correlations effectively, traders can capitalise on profitable trading opportunities.


Risk Management Techniques


While currency pair correlations can be beneficial for enhancing trading strategies, traders should implement proper risk management techniques to mitigate potential losses.


Position Sizing


Adjusting position sizes based on the correlation between currency pairs can help traders manage risk effectively. Traders may choose to reduce position sizes or avoid trading highly correlated pairs to minimise exposure to correlated market movements.


Advanced traders should carefully consider their risk tolerance and adjust their position sizes accordingly. By implementing appropriate position sizing techniques, traders can protect their capital and preserve their profitability.


Stop-Loss Orders


Using stop-loss orders can help limit losses and protect trading capital in the event of adverse price movements. Traders should place stop-loss orders based on the volatility and correlation of currency pairs to ensure adequate risk protection.


Advanced traders should set stop-loss orders based on their analysis of currency pair correlations and market conditions. By using stop-loss orders effectively, traders can minimise potential losses and preserve their trading capital.


Monitoring Correlation Changes


Currency pair correlations can fluctuate over time and in response to evolving market conditions. Advanced traders must consistently track correlation coefficients and modify their trading strategies to align with shifting market dynamics. By remaining attentive to changes in currency pair correlations and adeptly adjusting their trading approaches, traders can optimise their performance and effectively pursue their trading objectives.


Practical Examples and Case Studies


To illustrate the application of currency pair correlations in forex trading, let's consider some practical examples and case studies.


 Example 1: Diversification


A trader with a long position in EUR/USD may consider diversifying their portfolio by adding a short position in GBP/USD, which has a positive correlation with EUR/USD. This allows the trader to spread risk across multiple currency pairs and reduce exposure to adverse movements in the euro-dollar exchange rate.


 Example 2: Hedging

During periods of heightened market volatility, a trader holding a long position in AUD/USD may hedge their exposure by taking a short position in USD/JPY, which has a negative correlation with AUD/USD. This helps mitigate potential losses resulting from adverse movements in the Australian dollar-US dollar exchange rate.


Case Study: Correlation-Based Trading


A trader identifies a strong positive correlation between USD/CAD and crude oil prices due to Canada's significant oil exports. The trader takes a long position in USD/CAD and a short position in crude oil futures, anticipating that an increase in oil prices will lead to a corresponding appreciation of the Canadian dollar against the US dollar. This correlation-based trading strategy allows the trader to profit from the relationship between the two assets.


Conclusion


Currency pair correlations are a powerful tool for intermediate to advanced forex traders seeking to optimise their trading strategies and maximise profitability. By understanding the different types of correlations, analysing the factors influencing correlations, and leveraging correlation coefficients effectively, traders can enhance their performance and achieve their financial goals. Implementing proper risk management techniques is essential to mitigate potential losses and ensure long-term success in forex trading. By incorporating currency pair correlations into their trading plans and adapting to changing market conditions, traders can navigate the complexities of the forex market and achieve consistent profitability.


Currency Trading
Forex Trading
Trading Tips
18.03.2024
Trading and Brokerage
post image main
A Beginner’s Guide to Trading Forex
Fusion Markets


Embarking on your forex trading journey might seem daunting at first, but fret not! We’ve put together all the information you need to get started. 


This guide is your friendly companion, packed with real-world examples, easy-to-grasp basics, newbie-friendly strategies, handy tips, and a step-by-step roadmap to kickstart your forex adventures.


Contents 


Introduction to Forex Trading

How the Forex Market Works

Getting started in Forex Trading

Developing a Strategy 

Practical Tips for Beginners

Resources for Further Learning


Introduction to Forex Trading


Foreign exchange trading, or forex trading, is the process of buying and selling currencies in the global financial markets. It is one of the largest and most liquid markets in the world, with an average daily trading volume estimated to exceed USD$7 trillion. Unlike traditional stock markets, forex trading operates 24 hours a day, five days a week, allowing traders to participate in the market at any time.


Understanding currency pairs


Forex trading involves the exchange of one currency for another at an agreed-upon price. This is done with the aim of profiting from fluctuations in exchange rates. Currencies are traded in pairs, where one currency is bought while the other is sold. The most commonly traded currency pairs, or ‘the majors’ as they’re more commonly referred to, include EUR/USD (Euro/US Dollar), GBP/USD (British Pound/US Dollar), AUD/USD (Australian Dollar/US Dollar), NZD/USD (New Zealand Dollar/US Dollar), USD/JPY (US Dollar/Japanese Yen), USD/CAD (US Dollar/Canadian Dollar), and USD/CHF (US Dollar/Swiss Franc).


Examples of other currency pairs, most often referred to as “crosses”, are AUD/JPY (Australian Dollar/Japanese Yen), GBP/NZD (British Pound/New Zealand Dollar), EUR/CAD (Euro/Canadian Dollar) and so forth.


And finally, less-traded currency pairs are referred to as “exotics”. Examples of these include USD/TRY (US Dollar/Turkish Lira), USD/HUF (US Dollar/Hungarian Forint). It’s important to note that exotic pairs tend to have wider spreads and higher volatility compared to major and minor pairs.


Uses of the forex market


The forex market is used by many players, for many different reasons. Retail traders aim at buying or selling a currency to take advantage of short-term fluctuations in price, whereas corporates who conduct regular international trade often use the forex market to hedge against their local currency weakening.


Large-scale players such as hedge funds or investment firms, will use the foreign exchange market to take advantage of divergences in interest rates between two nations in the form of a carry trade.


For more information on the types of forex trading, head to Part Four.


Reading Currency Pair Quotes


Currency pair quotes consist of two prices: the bid price and the ask price. The bid price represents the price at which you can sell the base currency, while the ask price represents the price at which you can buy the base currency. The difference between the bid and ask prices is known as the spread, which represents the broker's profit margin.


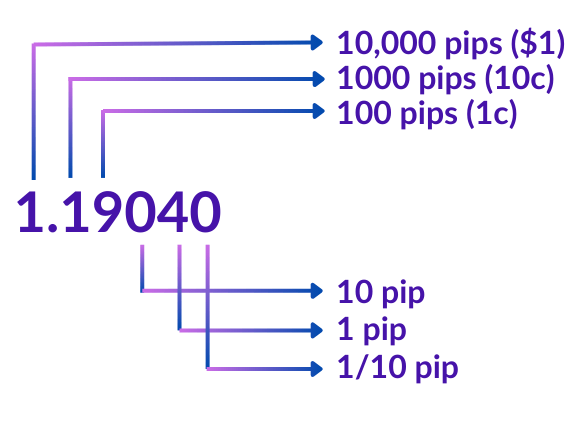
In forex trading, currency pairs are quoted in pips, short for "price interest point," representing the smallest possible price movement. For most major currency pairs, prices are quoted with four decimal points, indicating a change of 1/100 of one percent or 1 basis point. However, the Japanese Yen is an exception, trading with only two decimal points.


For instance, if the bid price for the EUR/USD pair is quoted as 1.19040, this breakdown refers to the five decimal places displayed on the market watch.


Pips EURUSD

How the Forex Market Works


In order to trade the foreign exchange market effectively, you need to understand the nuts and bolts of how it works.


The forex market is decentralised, meaning that there is no central exchange where all transactions take place. Instead, trading occurs over-the-counter (OTC) through a global network of banks, financial institutions, and individual traders. Some of the larger players in the forex market are Deutsche Bank, UBS, Citi Bank, RBS and more.


Prices are determined by supply and demand dynamics, with exchange rates fluctuating based on economic indicators, geopolitical events, and market sentiment.


How the system works


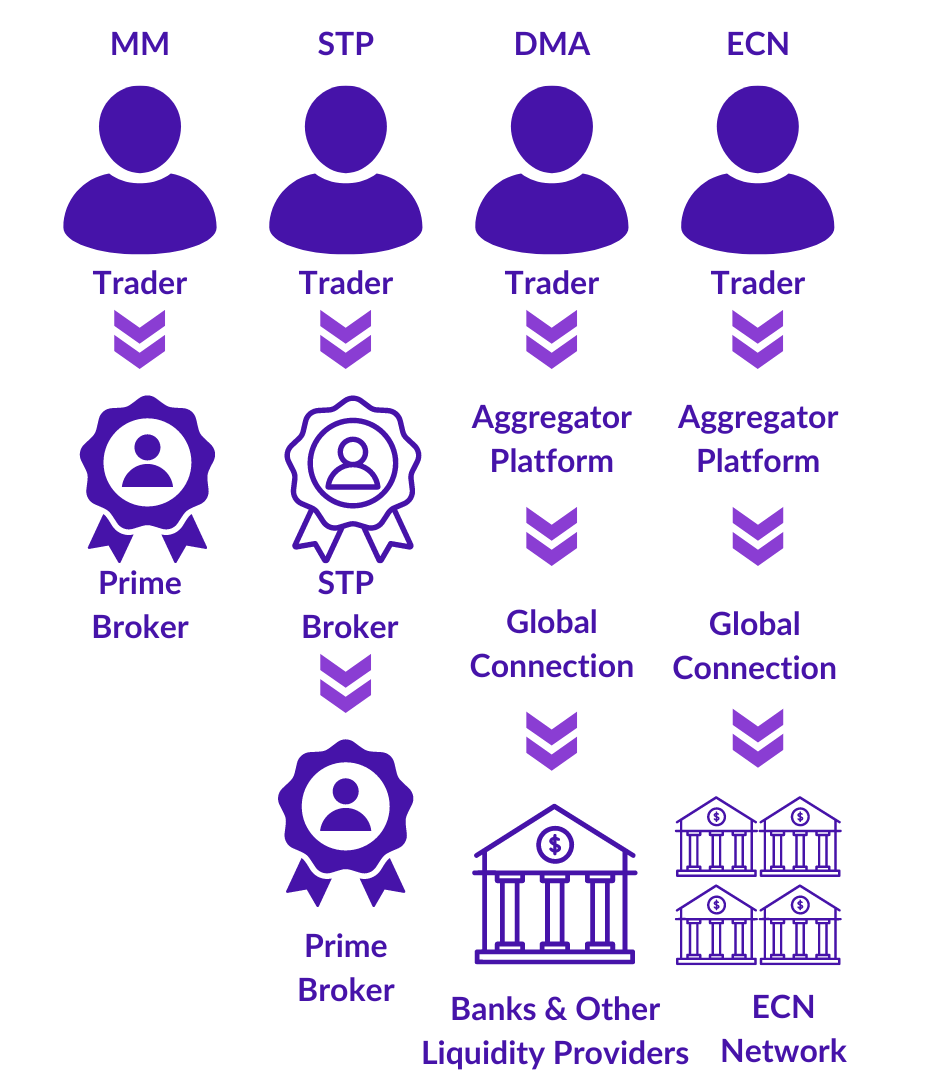
Market makers are key players in the forex world. They establish both the buying (bid) and selling (ask) prices, which are visible to everyone on their platforms. Their role extends to facilitating transactions with a diverse clientele, including banks and individual traders. By consistently quoting prices, they inject liquidity into the market. As counterparties, market makers engage in every trade, ensuring a seamless flow: when you sell, they buy, and vice versa.


Electronic Communications Networks (ECNs) play a crucial role in forex trading by aggregating prices from various market participants like banks, market makers, and fellow traders. They showcase the most competitive bid and ask quotes on their platforms, drawing from this pool of prices. While ECN brokers also act as counterparts in trades, they differ from market makers in their settlement approach rather than fixed pricing. Unlike fixed spreads, ECN spreads fluctuate based on market activity, sometimes even hitting zero during peak trading times, especially with highly liquid currency pairs like the majors.


Direct Market Access (DMA) empowers buy-side firms to directly access liquidity for securities they aim to buy or sell through electronic platforms offered by third-party providers. These firms, clients of sell-side entities like brokerages and banks, maintain control over trade execution while leveraging the infrastructure of sell-side firms, which may also function as market makers.


Straight Through Processing (STP) represents a significant leap in trading efficiency, transitioning from the traditional T+3 settlement to same-day settlement. One of its notable advantages is the reduction of settlement risk. By expediting transaction processing, STP enhances the likelihood of timely contract settlement. Its core objective is to streamline transaction processing by electronically transmitting information, eliminating redundant data entry and enabling simultaneous dissemination to multiple parties when necessary.


Market Makers Forex


Getting Started in Forex Trading


Choosing a Broker


When selecting a forex broker, it's essential to not only consider the fees, but also regulatory compliance, trading platform, and customer support. Look for brokers regulated by reputable authorities such as the Financial Conduct Authority (FCA) in the UK or the Commodity Futures Trading Commission (CFTC) in the US.


Here at Fusion Markets we’re dedicated to offering a quality service with an affordable fee structure. You can learn more about trading forex or view our licences


Setting Up Your Trading Account


Once you've chosen a broker, the next step is to open a trading account. This typically involves completing an online application, submitting identification documents, and funding your account. Forex brokers offer various account types to suit different trading preferences, including standard accounts, mini accounts, and demo accounts for practice trading.


Before risking real money, practice trading with a demo account to familiarise yourself with the trading platform and test your trading strategy in a simulated environment. Demo accounts allow you to gain valuable experience without the risk of financial loss. We also offer demo trading for those who want to test the water first.


Developing a Strategy


Identify Your Trading Style


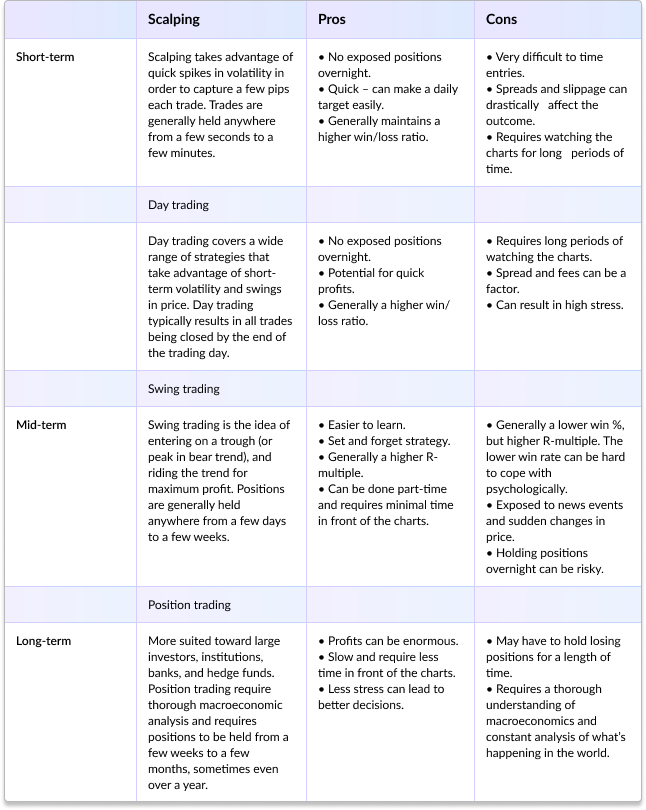
Before developing a trading strategy, it's essential to identify your trading style, whether it's day trading, swing trading, or position trading. Your trading style will dictate the timeframe you trade on and the types of setups you look for in the market.


Below are the types of pros and cons of each trading style:


undefined


Types of Analysis


Fundamental Analysis


Unlike technical analysis, which primarily relies on historical price data, fundamental analysis examines economic indicators, monetary policies, geopolitical events, and other macroeconomic factors to gauge the strength and direction of a currency's movement.


Central to fundamental analysis is the understanding that currency prices are ultimately driven by supply and demand dynamics, which in turn are influenced by broader economic conditions. For example, factors such as interest rates, inflation rates, GDP growth, unemployment levels, and trade balances can all impact a currency's value.


One of the key concepts in fundamental analysis is interest rate differentials. Central banks use interest rates as a tool to control inflation and stimulate economic growth. Currencies with higher interest rates tend to attract more investors seeking higher returns on their investments, leading to an appreciation in their value relative to currencies with lower interest rates. Traders closely monitor central bank announcements and economic reports to anticipate changes in interest rates and adjust their trading strategies accordingly.


Another important aspect of fundamental analysis is the assessment of economic indicators. These indicators provide insights into the health of an economy and can influence currency prices. For example, strong GDP growth and low unemployment rates are typically associated with a robust economy and may lead to appreciation in the currency. Conversely, high inflation or rising unemployment may weaken a currency.


Geopolitical events can also have a significant impact on currency prices. Political instability, conflicts, trade tensions, and other geopolitical factors can create uncertainty in the market and cause fluctuations in currency prices. Traders must stay informed about geopolitical developments and assess their potential impact on currency markets.


While fundamental analysis provides valuable insights into the long-term trends and direction of currency markets, it is important to note that currency prices can also be influenced by short-term factors and market sentiment. Therefore, traders often use a combination of fundamental and technical analysis to make informed trading decisions.


Technical Analysis


Technical analysis involves studying historical price data and using various charting tools and indicators to identify patterns and trends. Common technical analysis tools include moving averages, trendlines, and oscillators like the Relative Strength Index (RSI) and Moving Average Convergence Divergence (MACD). Traders use technical analysis to make short-term trading decisions based on price action and market momentum.


Technical analysis is a cornerstone of forex trading, offering traders a systematic approach to interpreting market dynamics and making informed trading decisions based on historical price movements and market statistics. Unlike fundamental analysis, which focuses on economic indicators and macroeconomic factors, technical analysis relies solely on price data and trading volume to forecast future price movements.


At its core, technical analysis is based on the efficient market hypothesis, which posits that all relevant information is already reflected in an asset's price. Therefore, by analysing past price movements, traders believe they can identify recurring patterns and trends that may indicate potential future price directions.


One of the fundamental concepts in technical analysis is that of support and resistance levels. Support represents a price level where buying interest is sufficiently strong to prevent the price from falling further, while resistance is a level where selling pressure is sufficient to halt an upward price movement. Traders use these levels to identify potential entry and exit points for their trades.


undefined

Example of support and resistance areas on EURUSD Daily chart


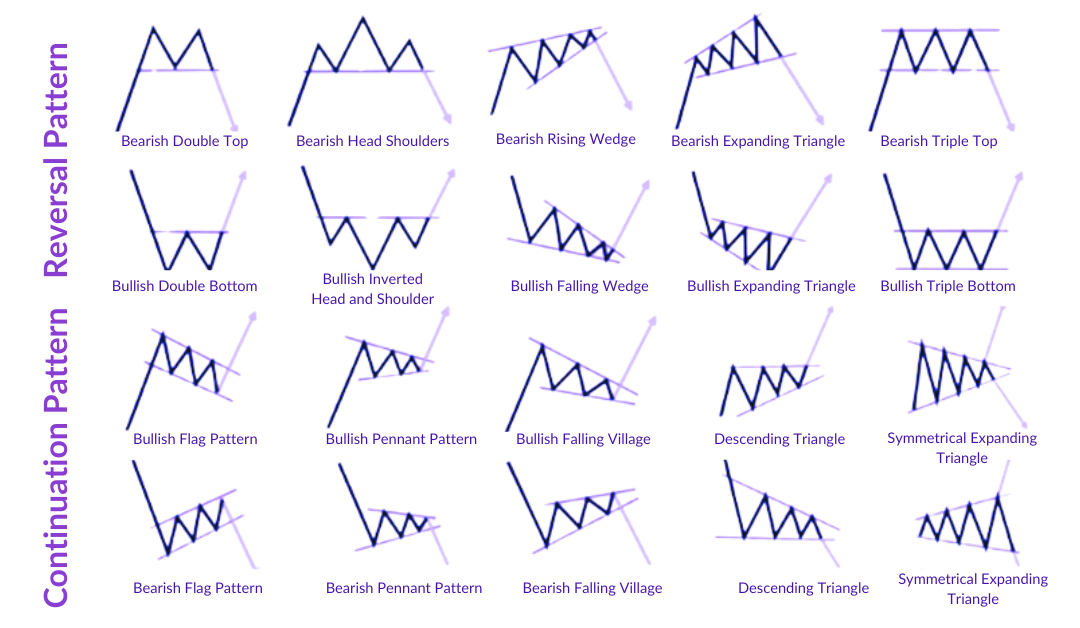
Another key tool in technical analysis is chart patterns, which are formed by the recurring movements of prices over time. Common chart patterns include triangles, flags, and head and shoulders formations. By recognising these patterns, traders attempt to predict future price movements and adjust their trading strategies accordingly.


undefined


In addition to chart patterns, technical analysts also utilise technical indicators to aid in their analysis. These indicators are mathematical calculations based on price and volume data and are used to identify trends, momentum, volatility, and other aspects of market behavior. Popular technical indicators include moving averages, oscillators like the Relative Strength Index (RSI) and the Moving Average Convergence Divergence (MACD), and trend-following indicators such as the Average Directional Index (ADX).


While technical analysis is a powerful tool for forex traders, it is not without its limitations. Critics argue that technical analysis is subjective and prone to interpretation bias, as different analysts may draw different conclusions from the same set of data. Moreover, technical analysis does not account for fundamental factors such as economic news and geopolitical events, which can have a significant impact on currency prices.


Despite these limitations, technical analysis remains an indispensable tool for forex traders worldwide. By understanding and applying technical analysis principles, traders can gain valuable insights into market trends and dynamics, allowing them to make more informed trading decisions and improve their overall trading performance.


Risk Management


Setting Stop-Loss and Take-Profit Orders


Stop-loss orders are used to limit losses by automatically closing a trade at a predetermined price level. Take-profit orders, on the other hand, are used to lock in profits by closing a trade when the price reaches a specified target. By using stop-loss and take-profit orders, traders can manage risk and control their downside exposure.


Position Sizing


Position sizing involves determining the appropriate amount of capital to risk on each trade based on factors such as account size, risk tolerance, and the probability of success. A common rule of thumb is to risk no more than 1-2% of your trading capital on any single trade to preserve capital and avoid significant drawdowns.


Your Strategy


Once you’ve determine what style of trading would suit you best, you now need to develop a strategy. There are thousands of different strategies out there so you have the choice of learning one from someone else, or developing your own.


Regardless, some common strategies include:


Trend Following Strategies


Trend following strategies in forex trading involve identifying and capitalising on established market trends. Traders employing this approach aim to enter positions in the direction of the prevailing trend, whether it's upward (bullish) or downward (bearish), and ride the momentum for as long as possible. These strategies typically utilise technical indicators, such as moving averages and trendlines, to confirm the direction of the trend and determine optimal entry and exit points. The goal of trend following strategies is to capture significant portions of a trend's movement while minimising losses during market reversals.


undefined

NZDUSD Daily Chart showing optimal entry points to go short during a bearish trend.


Range-bound strategies


Range-bound strategies in forex trading focus on exploiting price movements within defined ranges or boundaries. Traders employing this approach identify periods when a currency pair is trading within a relatively narrow price range, bounded by support and resistance levels. Instead of following a trend, range-bound traders seek to buy near support and sell near resistance, aiming to profit from the price being restricted to the range highs and lows.


undefined


USDJPY 15min chart with optimal buy and sell signals for a range-bound strategy


Breakout Strategies


Breakout trading strategies in forex involve capitalising on significant price movements that occur when an asset's price breaks through predefined support or resistance levels. Traders employing this approach wait for a clear breakout from the established range and then enter positions in the direction of the breakout, anticipating continued momentum in that direction. Breakout traders typically use technical indicators, such as trendlines, moving averages, and volatility measures, to identify potential breakout opportunities and confirm the strength of the breakout. The goal of breakout trading strategies is to capture rapid price movements and profit from the subsequent price trend.


undefined


Example of an opportune entry for a bullish breakout trade on EURUSD 4-hour chart


The key to developing a strategy that works for you is by studying the charts and thinking about what makes sense to you. If you think patterns make sense as they identify areas of consolidation which can lead to a breakout, then pattern trading could be a good fit for you.


It’s important for any trader to stick with their chosen strategy and not switch strategies every time they encounter a losing streak.


Practical Tips for Beginners


Maintain a Trading Journal


Keeping a trading journal allows traders to track their performance, analyse their trades, and identify areas for improvement. A trading journal should include details such as entry and exit points, trade rationale, risk-reward ratio, and emotional state. By reviewing past trades, traders can learn from their mistakes and refine their trading strategies over time.


Avoid Overleveraging


While leverage can amplify profits, it also increases the risk of significant losses. Avoid overleveraging by using leverage cautiously and only trading with capital you can afford to lose. A general rule is to keep leverage levels below 10:1 to mitigate risk effectively. The best position is cash. You should ensure you’re only taking the most high-probability set-ups that are in-line with your strategy.


Stay Disciplined


Maintain discipline in your trading approach by sticking to your trading plan and avoiding emotional decision-making. Avoid chasing losses or deviating from your strategy based on fear or greed. Consistency and discipline are key to long-term success in forex trading. Sometimes it’s best to walk away from the charts and come back the next day with a clearer head.


Manage Emotions Effectively


Trading can be emotionally challenging, with the potential for both euphoria and despair. Learn to manage your emotions effectively by practicing mindfulness techniques, maintaining a positive mindset, and taking regular breaks from the market. Remember that losses are a natural part of trading, and it's essential to stay resilient and focused on your long-term goals.


We highly recommend reading our article on the Top 10 Hidden Biases here.


Be realistic with your expectations


Trading can be very lucrative, but it can also be very costly. Traders should be realistic in their expectations – what % will you aim for each month? How much are you going to risk? Risking 20% of your equity per trade will be great on winning trades, but it won’t take long for you to eradicate your entire balance on a handful of losses. Whereas risking 1% equity per trade will allow you to conserve as much capital as possible, whilst still gaining 1%+ per winning trade.


Resources for Further Learning


To continue your forex trading education, consider exploring the following resources:


  • Books: "Currency Trading for Dummies" by Brian Dolan, "Japanese Candlestick Charting Techniques" by Steve Nison, and "Market Wizards" by Jack D. Schwager.
  • Online Courses: Investopedia Academy, Udemy, and Coursera offer a variety of forex trading courses for beginners and advanced traders.
  • Forums and Communities: Join online forums and communities such as Forex Factory, BabyPips and TradingView to connect with other traders, share ideas, and learn from experienced professionals.


Ready to get started?


Sign up for a free Demo account with us today.


Trading Tips
Beginners
Forex
Forex Trading
Trading Psychology
06.03.2024
Market Analysis
post image main
GBP/USD: An Overview
Fusion Markets

The forex symbol GBP/USD indicates how much the British Pound (abbreviated as GBP) is worth in relation to the US Dollar (abbreviated as USD). This article provides traders information on how much USD is needed to buy one GBP. Forex traders call an exchange of this pair as “trading the cable,” a nod to how New York and London used to transmit trading information.


The GBP/USD pair is among the oldest currency pairs traded in the world. It is also among the most popular pairs to trade and is considered a major forex pair.


If you’re considering trading this pair, read on for a quick dive into the history of these currencies, their dynamics, and how you can trade this pair.

If you want to read more articles about our pairs, check out our posts on: USD/JPY and EUR/CHF.


Currency background


The British Pound (GBP)


GBP is the official currency of the United Kingdom and its territories. Its history can be traced back to continental Europe. With over 1,000 years of history, it is one of the oldest, if not the oldest, currency still in use. In 1694, the Bank of England was established, and banknotes entered circulation shortly after.


The GBP’s importance goes beyond the UK and its territories. It used to be the dominant international currency before USD took over in the 20th century. However, it is still among the most widely used currencies for financial transactions worldwide, along with the USD and the Euro (EUR). Further, as of 2021, the GBP comprised 5% of official foreign reserves (i.e., share of currency reserves held by central banks).


The US Dollar (USD)


USD is the official currency of the United States, dating back to the 18th century. In 1785, the US adopted the dollar sign, which is now, perhaps, the most recognizable currency symbol in the world.


The USD plays a major role in the global economy, dominating international finance. It is the most active currency for international payments. It has also been the top international reserve currency since World War II, with an over 50% share of global reserves. In forex markets, almost 90% of all transactions involve USD.


The Plaza Accord


No background of these two currencies would be complete without mentioning the historic Plaza Accord.


In 1985, the US, UK, France, Germany, and Japan—then known as the G-5—agreed to jointly intervene in the currency markets to correct trade imbalances. The devaluation of USD was meant to reduce the increasing US trade deficits.


In a couple of years that followed the agreement, the USD declined in value by about 50%, while GBP and the other currencies appreciated by about 50%.


Factors you need to consider in trading GBP/USD


The GBP/USD pair is among the most liquid in the forex market, with smooth price movements as there’s enough volume of trade in the market.


Various factors move the prices of currency pairs in the forex market. For most currency pairs, prices are affected by economic trends and geopolitical circumstances, both locally and globally.


Here are some factors that drive the GBP/USD dynamics:


Economy


Both the US and the UK are among the largest economies in the world.


Due to its size and role in the global economy, the economic situation and policies in the US affect many economies and markets worldwide. In general, the GBP/USD rises when the UK economy grows more than US economy.


If you’re trading US-based pairs, you can keep up to date with US economy updates through government data releases and economic reports or Fusion's economic calendar, which includes data such as GDP growth, interest rate decisions and balance of trade.


Trade balance


The US is one of the three largest players in global trade, along with the European Union and China. The US is among UK’s major trading partners, accounting for about 10% of UK imports and receiving over 15% of UK goods exports.


The trade balance situation generates some volatility for GBP/USD. GBP/USD rises when current account balance (i.e., the balance of trade between the two countries) increases for the UK.


Central Bank policies


The Federal Reserve (Fed) sets the monetary policy in the US, a key determinant of currency strength, with the aim of stabilizing US prices and maximizing employment. In the UK, the Bank of England (BoE) sets the interest rate to maintain low and stable inflation. It reviews rates every 6 weeks.


A rule of thumb here is that the pair rises when the BoE interest rates rise more than the Fed rates.


As the USD plays an important role in international markets, movements in interest rates set by the Fed have a critical impact on the movement of many currencies worldwide, including GBP. In 2022, steep rate increases have strengthened the US dollar, causing other currencies to dive as investors rush to USD.


Geopolitical conditions and global risks


Like other currency pairs, the GBP/USD is also driven by political uncertainties and global risks.


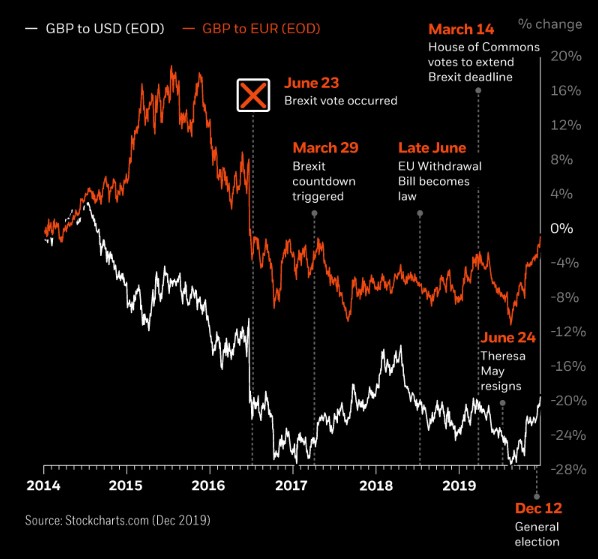
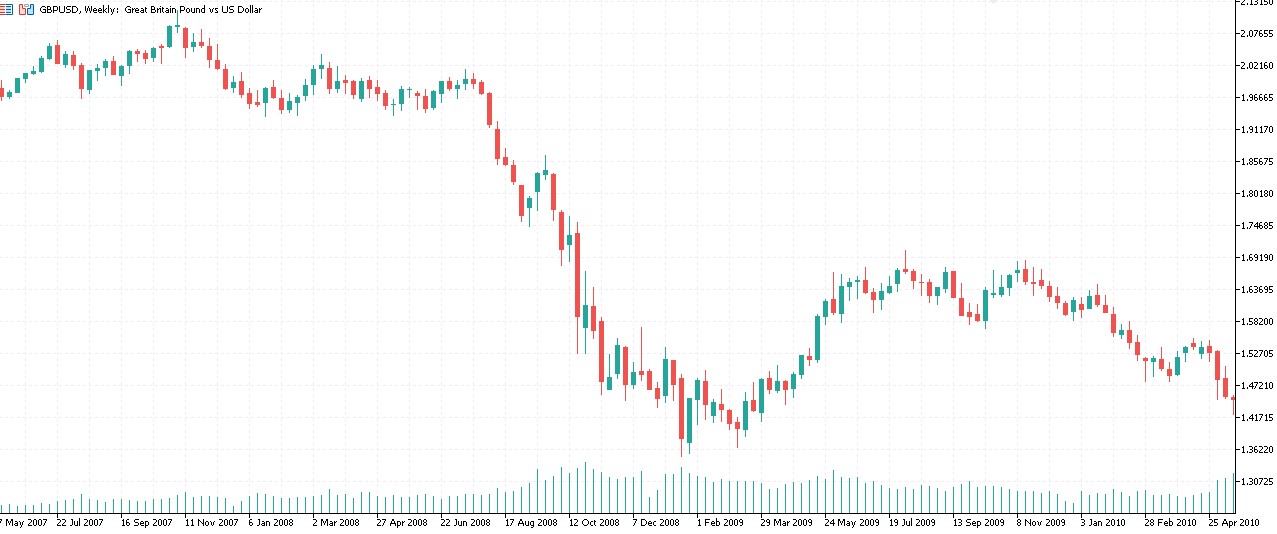
The GBP took a hit following the global recession in the late 2000s. In 2016, after the announcement of Brexit, the GBP dived to its lowest against the USD, as UK’s decision created uncertainties to how its trade prospects would pan out.


undefined

GBP/USD and GBP/EUR - 2014-2021


As USD is a global reserve currency, it serves as a haven at times of global uncertainties. During the height of the COVID-19 pandemic in 2020, the GBP/USD rate dropped by 12% as investors sold the GBP and rushed to the safer USD.

 undefined

GBP/USD and GBP/EUR - 2007-2010


Conclusion


Is the GBP/USD pair worth going into?


The US and the UK are among the largest economies in the world, with both USD and GBP playing important roles in international finance. The two countries share strong economic relations.


In forex markets, almost 90% of all transactions involve the USD. Post-1980, the pair has been less volatile, with extreme movements stemming from major global and regional events such as the Brexit and the COVID-19 global situation. The pair is one of the most liquid in the market.


If you’re new to the forex market, trading with highly liquid currencies such as GBP/USD could benefit you. This is because many strategists recommend trading in these currency pairs while you’re still improving your grasp of forex trading. You're also in luck, in that, Fusion Markets is the lowest cost regulated broker on the market. Start trading today!  


GBP
USD
Currency Trading
Forex Trading
14.10.2022
Market Analysis
post image main
EUR/CHF: An Overview
Fusion Markets

The forex symbol EUR/CHF indicates how much the Euro (abbreviated as EUR) is worth in relation to the Swiss Franc (abbreviated as CHF), and how many Swiss Francs you need to buy one Euro. The pair is nicknamed “Euro-swissie” in the FX market.


As a cross-currency pair, EUR and CHF are traded directly, without the need to convert to a base currency first. This is also commonly known as currency pairs that do not involve the US Dollar (USD). The EUR/CHF currency pair is among the most popular cross-currencies in the forex market.


In this article we breakdown the history of these currencies, their dynamics, and how you can trade this pair. 


For more currency pair breakdowns, check out our USD/JPY Overview.


Currency background


The Euro (EUR)


As of 2022, 19 out of the 27 member countries of the European Union (EU) use EUR as their official currency.


Since its debut in 1999 and entry into circulation in 2002, EUR has become one of the most widely used currencies for financial transactions worldwide, often second only (or at times at par with) USD.


Owing to its credibility, EUR has also, until recently, been a relatively stable currency. This stability has allowed it to extend its importance well beyond the EU. Over 50 other countries and territories globally have adopted the EUR as currency or have pegged their currencies to EUR. Furthermore, it accounts for over 20% of global foreign exchange reserves, second only to USD.


The Swiss Franc (CHF)


CHF is the official currency of Switzerland, as well as of Liechtenstein. In contrast to EUR, CHF traces its origin over a century back to 1850.


CHF is among the top ten most traded currencies globally. It has long been considered a safe-haven currency, owing to the stability of the Swiss economy and its political neutrality. However, unlike EUR, no other country uses CHF as a peg for their own currency.


What to consider in trading EUR/CHF


Compared to most currency pairs in the market, EUR/CHF experiences fewer price movements. The trends are typically slower and more stable.


Several factors affect the prices of currency pairs in the forex market. For most currency pairs, price movements are mostly tied to economic and geopolitical circumstances, both locally and globally.


Here are some factors that drive EUR/CHF movements:


Economy


The EU, as a single market, is one of the largest economies in the world and one of the three most prominent players in global trade. It is Switzerland’s primary trading partner, with the EU accounting for over 60% of Swiss imports and receiving over 40% of Swiss exports. The economic situation in the Eurozone has a history of affecting the Swiss economy, such as in the 2010s.


If you’re trading EUR-based pairs, you can keep up to date with happenings in the EU economy through European Commission economic reports, including economic forecasts and reviews, as well as Fusion's Economic Calendar. The European Central Bank also publishes economic bulletins that provide insights on monetary policy, a key determinant of currency strength.


Swiss policies


The Swiss National Bank, which issues CHF, has traditionally been non-interventionist. Several of its moves, however, have impacted currency markets. In 2011, it pegged the CHF to EUR, in a move to help Swiss businesses to increase their profitability. A few years later, in 2015, it abandoned the peg, stunning investors, causing market turmoil, and leaving a profound impact on the EUR.


EUR/CHF chart of Euro Peg and Depeg

EUR/CHF 2011-2015 Weekly Time Frame


Global risks


Investors on the move to mitigate global economic risks are drawn to CHF due to its solid reputation for financial stability. In the aftermath of the global financial crisis in the late 2000s, widespread buying of CHF saw a 20% depreciation of EUR to CHF.


Geopolitical conditions


Investors also turn to CHF in times of political uncertainty in the EU, such as during the Greek sovereign debt crisis following the 2008 financial crisis. Demand for CHF had also soared during the Brexit negotiations, with investors using it as a hedge for protection against Brexit.


Movements in USD


A distinct advantage of EUR/CHF is its independence from USD. As they can be directly traded with each other, the pair isolates traders from USD-related volatilities. 


Conclusion 


The EU is one of the largest economies in the world, with EUR used in a majority of global transactions. The EU and Switzerland are not only geographically close, but also share strong economic ties, such as trade relations.


The EUR/CHF as a cross-currency pair experiences fewer price movements, with less volatile trends compared to other forex pairs. Both currencies are credible, with CHF long considered a safe-haven currency. Even during the COVID-19 global pandemic, investors have trusted CHF.


If you're looking to trade EUR/CHF, you'll be able to get ultra-tight spreads and $2.25 commissions per lot with Fusion Markets. Don't wait on the sidelines, be part of the action.


EUR
CHF
Forex Trading
Currency trading
03.10.2022
Newsletter
Top Articles
Popular Tags
Ready to Start Trading?
Get started live or get a free demo